Insights
‘Paris-proof’ targets: Energy Usage Intensity explained.
Tackling Net Zero Carbon in existing buildings.
The term energy-use intensity (EUI) is going to be on every building owner’s lips soon.
But what is it?
EUI is the total amount of energy used in a building in a year divided by its floor area. The units are kWh/m2, and can be determined by either meters or utility bills.
Why is it so important?
The focus on EUIs is to stop the reliance on green electricity as a sole method of reaching net zero carbon on a building. If you have a building which is heated through gas, the simplest way to a zero-carbon building is to replace your gas boiler with a heat pump and then to obtain all of your electricity from a ‘green’ or renewable source.
The problem is that there is insufficient renewable electricity generated on the grid to cover all buildings going all-electric. In fact, there is only enough to cover about 40% of buildings.
However, if each building were to reduce its energy use by 60% then, in theory, it would be possible to ensure all buildings are run entirely on green electricity. This, in turn, would allow the UK to meet its obligations under the COP 21 Paris Agreement. As such, ‘Paris-proof targets’ essentially means an average of a 60% reduction in building energy use.
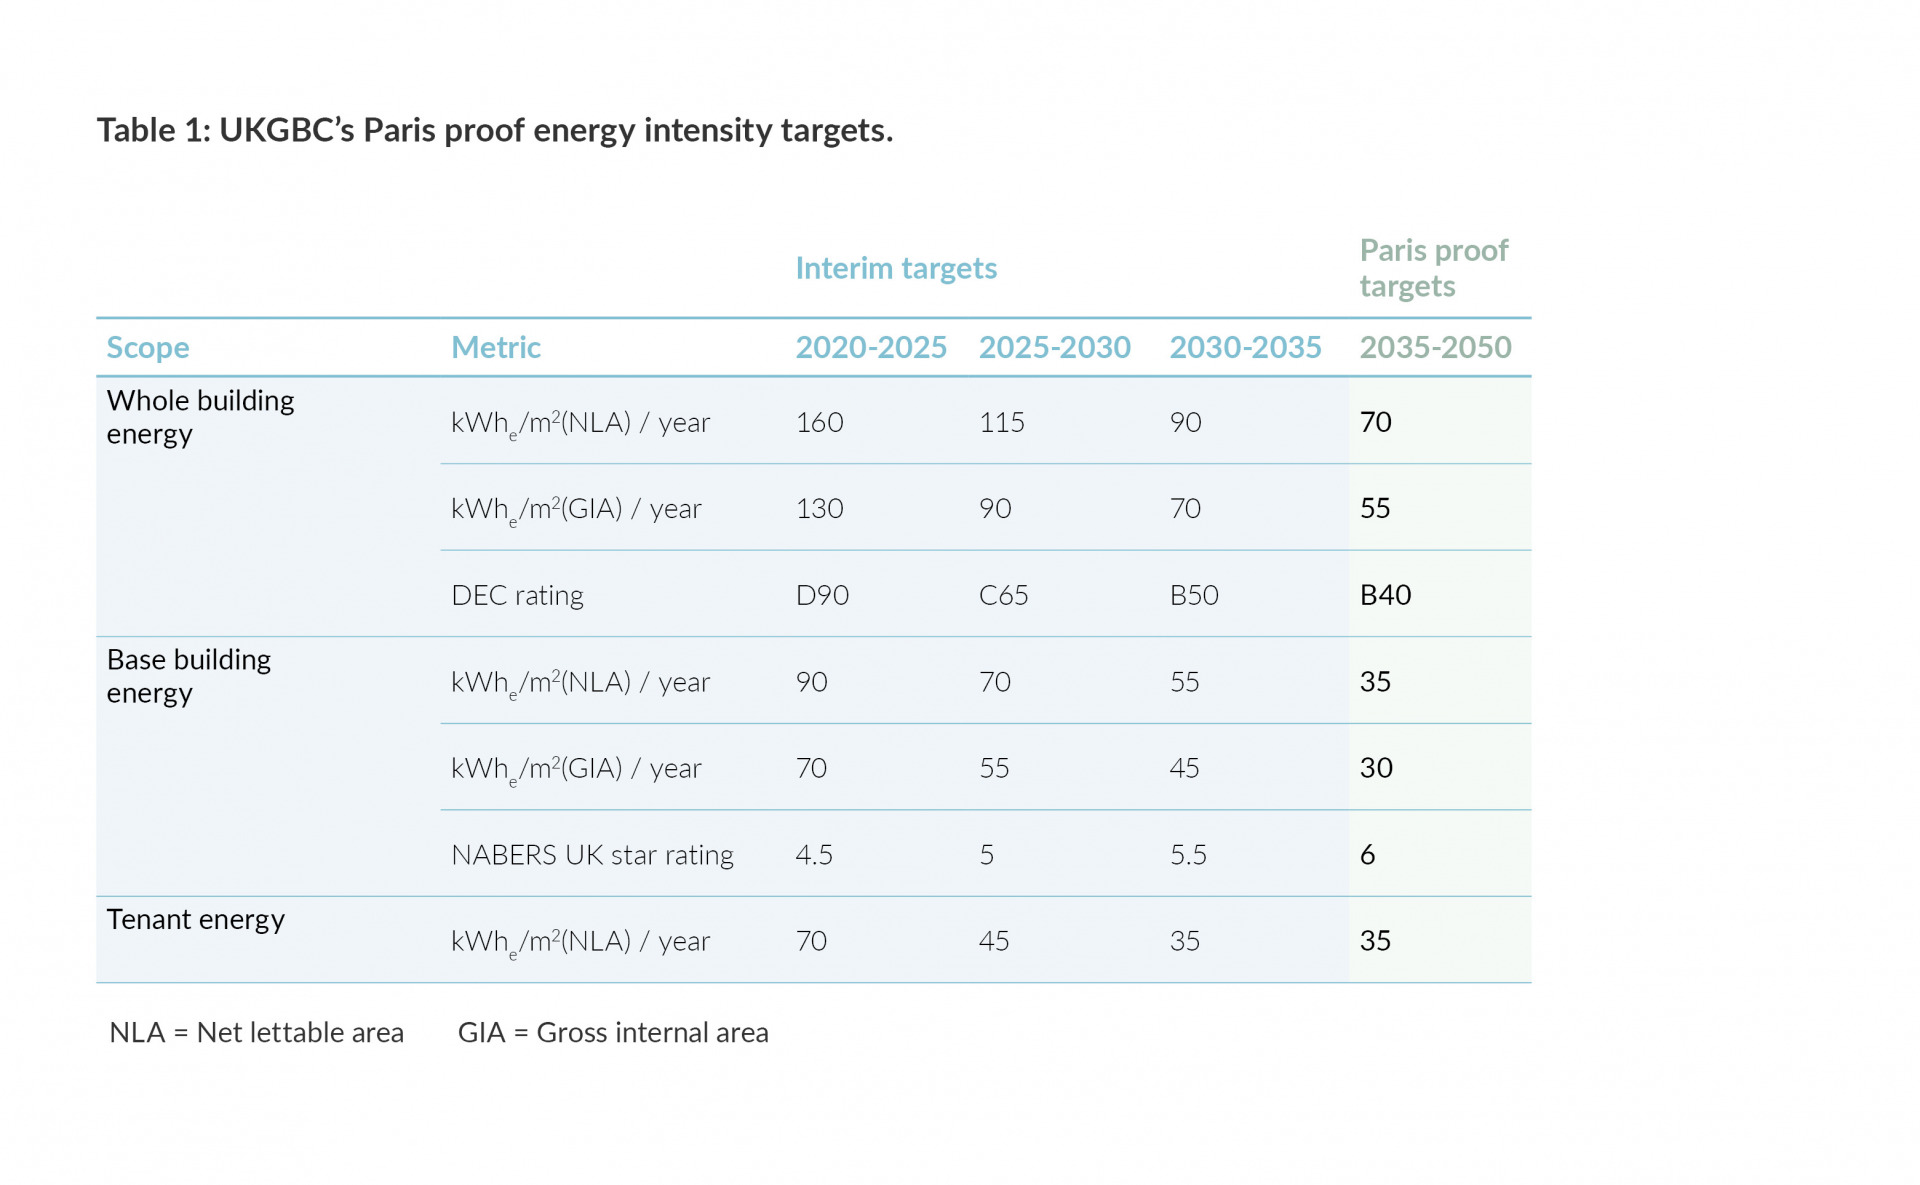
The UKGBC has produced a suggested process for achieving these ‘Paris-proof targets’, with interim targets shown here:

What is interesting to me in the above is the starting point: the figures under the 2020 column. These figures are based on a typically performing office building, which is fine for this purpose. But what happens when you have to apply this to a real-life scenario of an existing building, already built and not achieving the DEC of D90? We all know that there is no such thing as a ‘typically performing’ building.
Our real-life scenarios could be performing way better or way worse…and either way they need to meet the 60% reduction.
As such, one way to approach this target for existing buildings is to look at the percentage reductions for each interim target:
As such, one way to approach this target for existing buildings is to look at the percentage reductions for each interim target:
| Whole building energy | 2025 | 2030 | 2035 | 2050 |
| kWh/m2 | 130 | 90 | 70 | 55 |
| % | – | 31% | 22% | 21% |
Taking an example of a typical building (which could use, say, 203kWh/m2), the interim targets could look like this:
| Whole building energy | 2025 | 2030 | 2035 | 2040 | 2045 | 2050 |
| kWh/m2 | 130 | 90 | 70 | 65 | 60 | 55 |
| % | – | 31% | 22% | 7% | 8% | 8% |
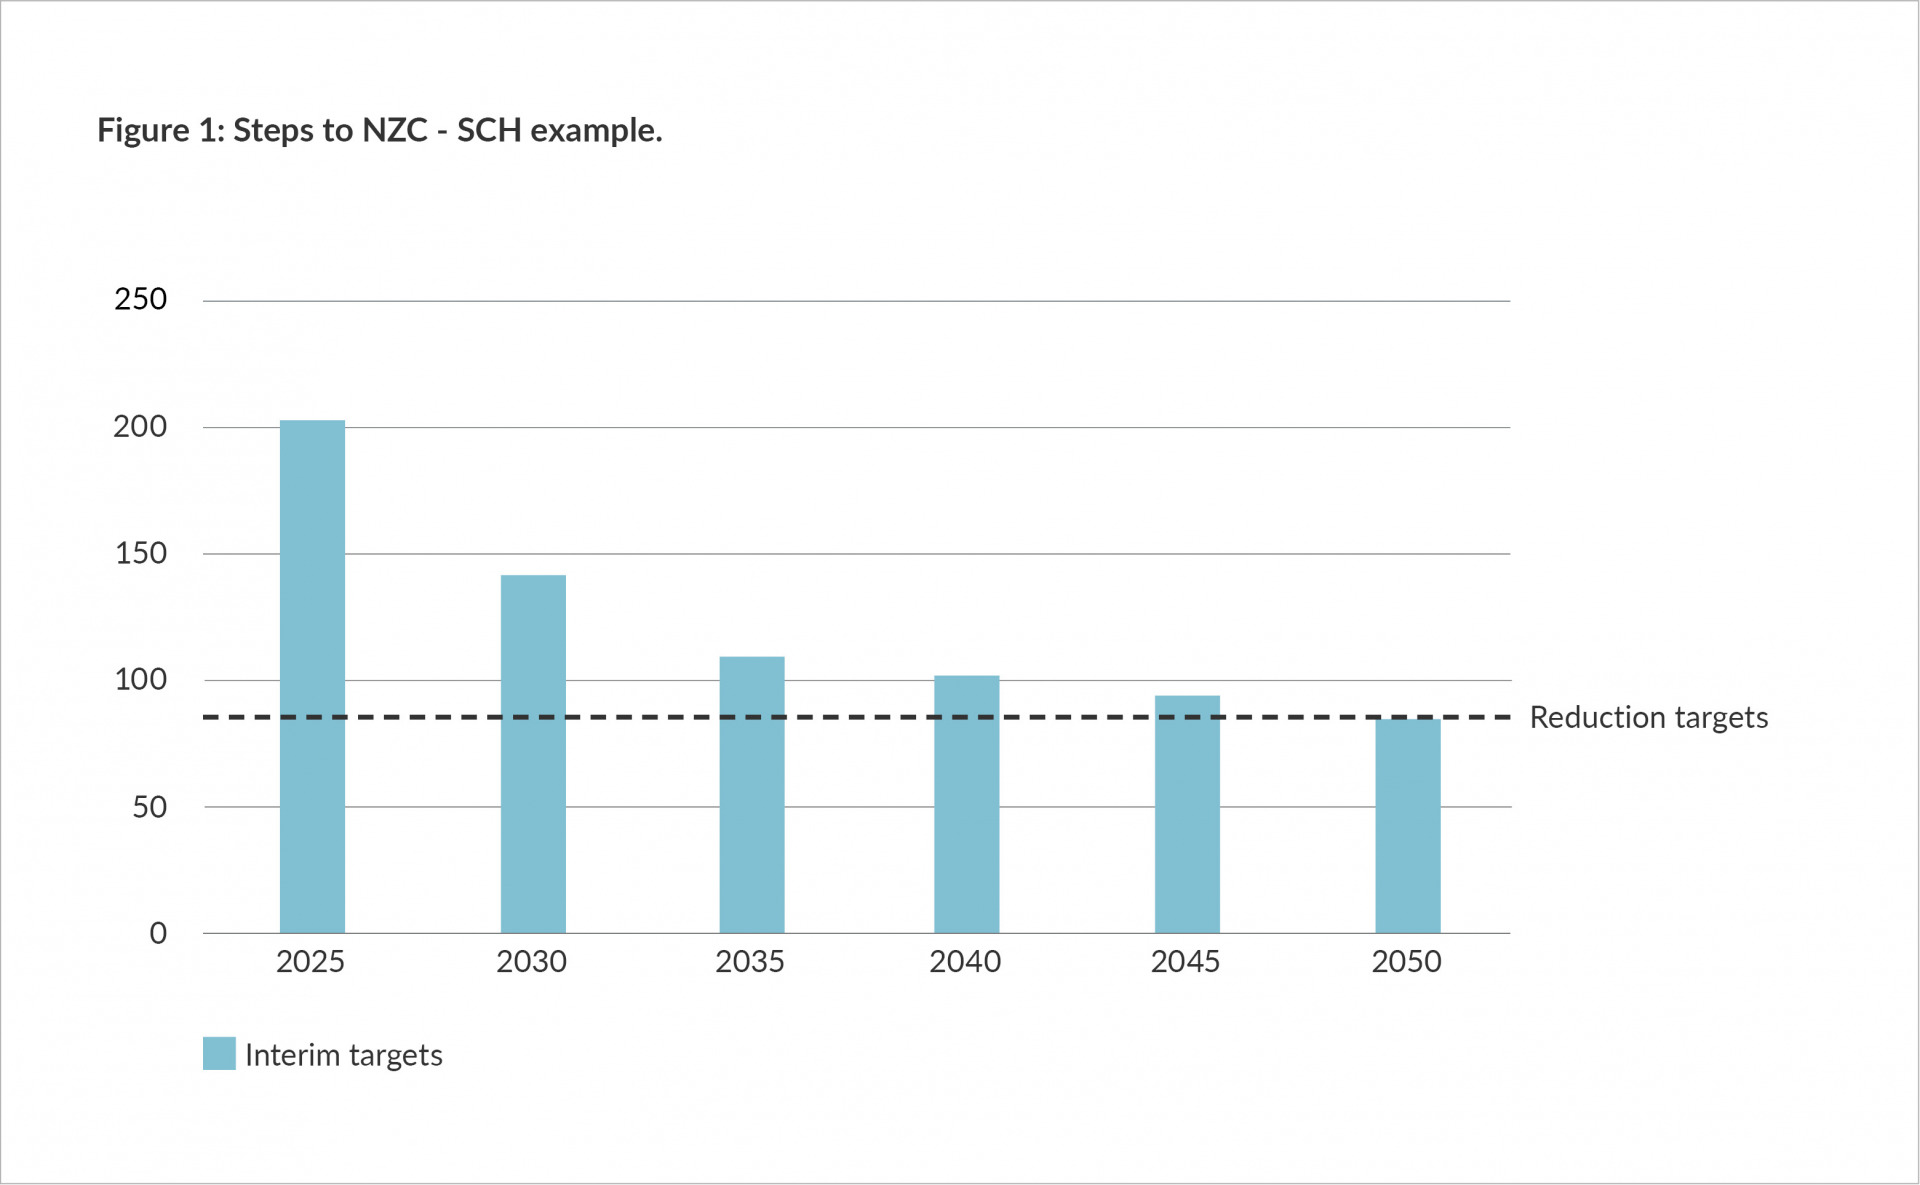
| Building energy use | 203 | 141 | 109 | 102 | 94 | 86 |
You might have noticed that I’ve added a couple of additional columns here; this is to ‘even out’ the interim targets to allow a new target reduction every five years. Graphically it looks like this:
 For our sample building, these would be the ‘Paris-proof’ science-based targets for EUI.
The next step is how do we reach them? Well, that’s a whole other article, and a discussion were having with many of our clients…Watch this space!
